Predictive analytics
Forecast sales, footfall and stock needs with models that keep learning as your business changes.
Tired of wrestling with spreadsheets that hide the real story? A custom AI dashboard puts every critical metric in one live, visual command centre.
We design, build and deploy bespoke AI-powered dashboards that turn raw data into forecasts, alerts and visualisations. Your team gets clarity fast, without the reporting chaos.
40%
Average time saved on reporting after launch.
Real-time
Live sync with POS, CRM or EHR data.
2–6 weeks
Typical delivery window, depending on scope.
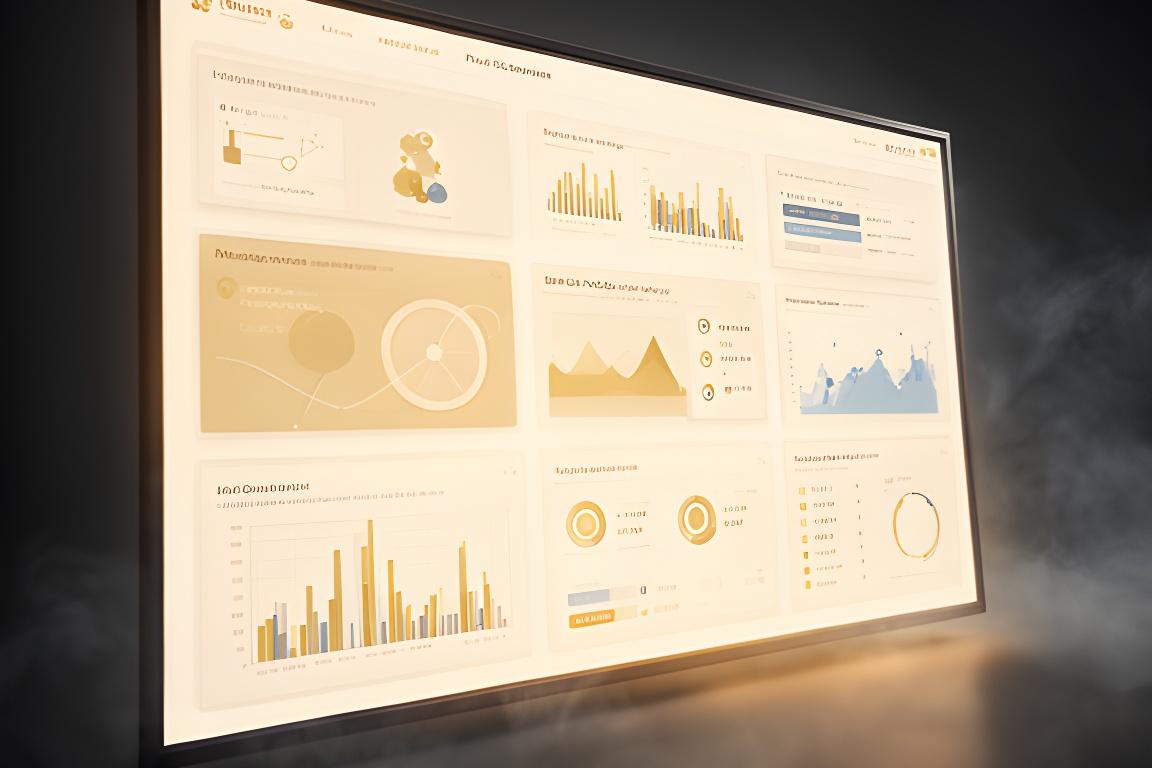
Why wait for month-end spreadsheets when your data can speak immediately?
Models improve over time, so your forecasts become sharper with every cycle.
What makes our dashboards different
If your current reporting stack feels clumsy, why keep patching it? We make AI data visualisation useful, understandable and fast to trust.
Forecast sales, footfall and stock needs with models that keep learning as your business changes.
Connect to the tools you already use, so KPIs update automatically instead of being copied by hand.
Your team can check the dashboard on any device. Why make insight desktop-only?
We build charts, maps and gauges around your sector, not generic templates that miss the point.
Present your own branding with client-facing reporting that still feels polished and credible.
Every build is documented, tested and handed over with practical training so your team stays confident.
Your dashboard journey
Want a smoother build process? We keep it collaborative, visible and grounded in your real data from day one.
Step 1
We audit your data sources, ask direct questions and map the metrics that matter most. What would you stop tracking tomorrow?
Step 2
We co-create the first layout with your team in real time, so the dashboard feels familiar before it ever goes live.
Step 3
We connect your sources, shape the rules and train predictive engines that feed the visual layer with useful context.
Step 4
Your real data is tested in a safe environment. Any rough edges are ironed out before launch day arrives.
Step 5
We launch with hands-on training, then refine the dashboard as your usage patterns reveal the next best improvements.
Dashboards in action
Need a clearer picture of your sector? These use cases show how business intelligence tools UK teams can actually use every day.
Appointment forecasting and patient outcomes.
Reduce no-shows, spot demand patterns and plan staff time with more confidence.
Stock alerts and expiry monitoring.
Catch low inventory sooner and reduce waste from items nearing expiry. Simple, but powerful.
Purchase patterns and footfall maps.
See which collections drive repeat visits, then steer buying decisions with real evidence.
Cost and timeline indicators.
Track shifts early, forecast slippage and keep project managers informed before problems grow teeth.
Attendance trends and churn risk.
Identify quieter periods, predict drop-off and build retention plans before members drift away.
Milestones and billing projections.
Keep cases visible, protect fee recovery and make forecasting less of a guessing game.
Trusted by UK businesses
“Harris Vision’s dashboard saved us 15 hours a week on reporting. We finally know what’s happening before the day ends.”
Sarah L., Pharmacy Owner
“We now forecast patient demand with 95% accuracy.”
Dr Patel, Dental Clinic
“Our boutique now sees exactly which collections drive repeat visits.”
Chloe M., Fashion Retailer
Flexible packages
Which stage are you at right now? Start small, then expand once the dashboard proves itself inside your day-to-day workflow.
Starter
Ideal for a single department or a pilot project.
From £
Basic AI insights
Free data audit
Onboarding session
Growth
Best for teams that need more than one live feed.
From ££
Predictive models
Live alerts and thresholds
Data audit and onboarding
Enterprise
For organisations that need control, scale and support.
From £££
Dedicated support
API access
Full white-label branding
Your dashboard questions answered
Typically 2–6 weeks depending on complexity, data quality and the number of integrations involved. Do you need a faster pilot? We can usually scope one.
Yes. We work with most EHR, POS and ERP systems, plus other data sources through APIs, exports and secure connectors.
Absolutely. We provide hands-on sessions and short video guides, so your team knows how to read, filter and act on the dashboard confidently.
We offer monthly support and optimisation plans, because dashboards should keep improving as your business evolves.
Let’s build something brilliant together
If your data is scattered, your decisions are slower than they should be. Why keep making expensive guesses when a live AI dashboard can show you what matters now?
Office location
A simple reference point for meetings, local clients and service planning. Prefer a call first? That works too.