Harris Vision AI

We believe data should work for everyone

Behind every clever dashboard is a team that cares about your results as much as you do. We started Harris Vision in London with a simple belief: AI should feel practical, human, and within reach for independent businesses. Why should only the big players get the good stuff?

London-based team AI dashboard specialists Community-rooted
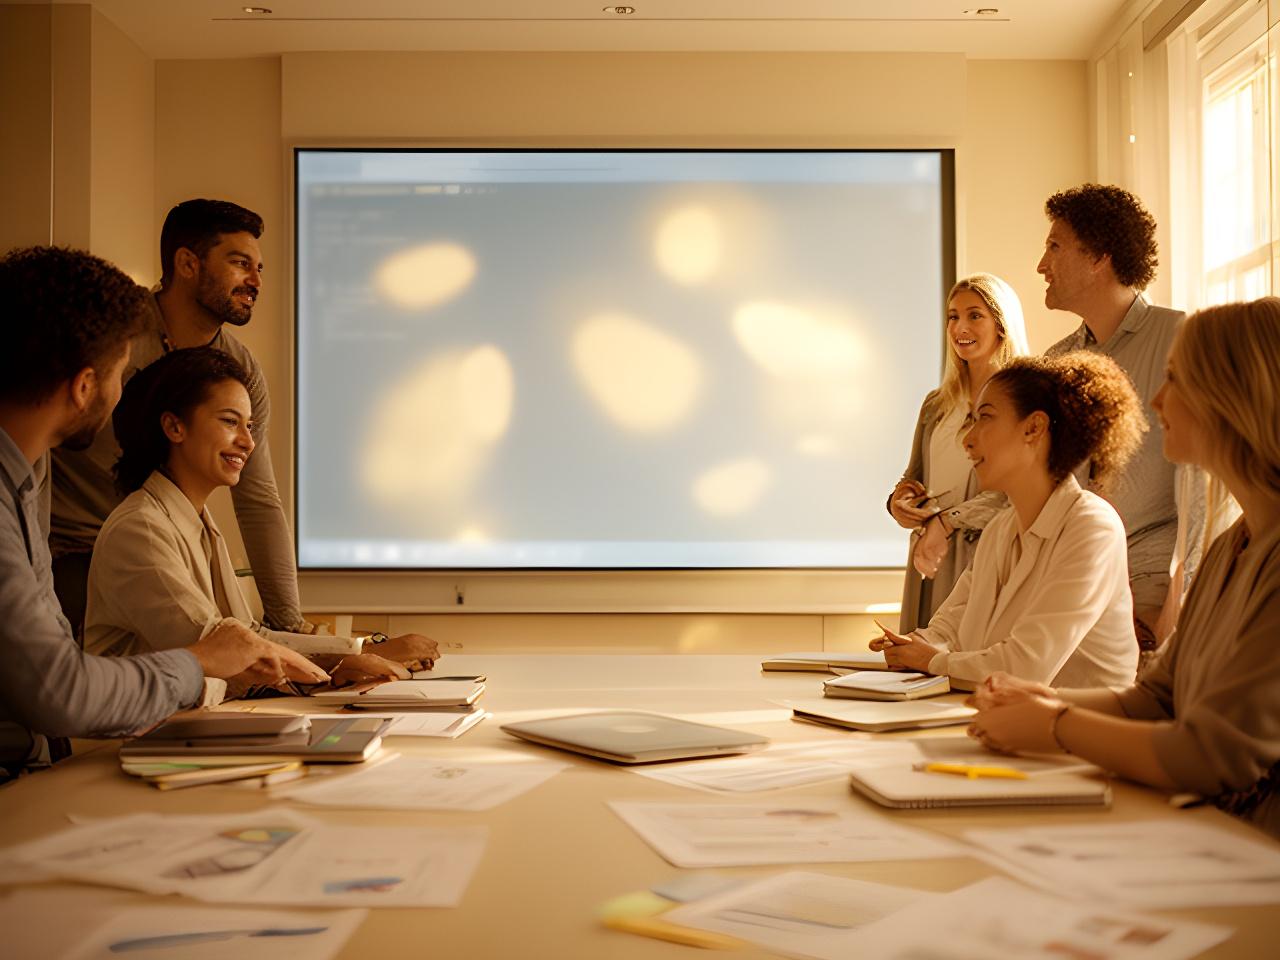
Harris Vision team gathered around a dashboard display in a London office with warm daylight and notebooks on the table

Making AI analytics human-sized since 2020

Personal dashboards. Clear decisions. Less noise.

Our story

From spreadsheets to smiles

We were two data scientists staring at overflowing Excel files and thinking, surely this can be better. The first dashboard we built was for a local pharmacy; it trimmed stock waste by 20% in a matter of weeks. That was the moment it clicked. Could AI be useful, calm, and genuinely friendly? Absolutely.

2020

A London office, a small team, a big idea

Harris Vision was founded by people who believed the best analytics should be easy to read and even easier to trust. The aim was never to impress with complexity. It was to help owners see what mattered before the week ran away from them.

Growth with purpose

From one pharmacy to six specialist sectors

Our team now brings together ex-NHS data analysts, retail strategists, and UX designers, giving each dashboard both technical depth and real-world clarity. We’re still based on Islip Street, because staying close to the communities we serve keeps us sharp. Why move far from the people who shaped the work?

Today

A 12-person AI data visualization team, built for the UK

We design, build, and support every dashboard from our London workshop. That matters to clients who want continuity, straight answers, and a partner who understands sector-specific pressure. No hand-offs. No mystery.

The faces behind the algorithms

A team with different backgrounds, one shared standard

We like people who notice small things. A hospital workflow. A shop-floor bottleneck. A chart that makes sense in two seconds rather than twenty. Who wouldn’t want that on their side?

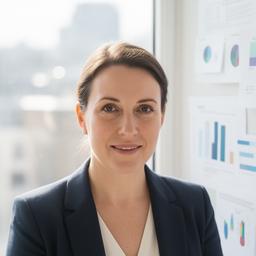
Portrait of Amelia Wren in the London office beside a dashboard screen

Amelia Wren

Lead Data Scientist

Amelia turns messy operational data into crisp decision paths. She has 15 years of analytics experience, and she can still spot a broken KPI faster than most people spot a typo.

Fun fact: she makes a very serious flat white.

Why she matters

Amelia leads model design with a strict rule: predictions must be explainable, useful, and honest. If a chart can’t be defended in a meeting, it doesn’t leave her desk.

Portrait of Owen Bleasdale working near interface sketches and notes in the studio

Owen Bleasdale

Head of UX

Owen makes dashboards feel calm, not crowded. He’s spent years in retail interface design, and he believes every number should arrive with enough breathing room to be understood.

Fun fact: he never misses the best coffee grinder setting.

Why she matters

He tests for clarity on real users, not just in theory. That means less clutter, better focus, and dashboards that feel genuinely welcoming.

Portrait of Nadia Ikhsan reviewing charts beside a bright office window in London

Nadia Ikhsan

Client Director

Nadia keeps projects grounded in business reality. She has a finance background, a habit of asking excellent questions, and the patience to translate strategy into next steps.

Fun fact: she remembers every client’s preferred biscuit.

Why she matters

Nadia makes sure the work fits the sector, the team, and the pace of your business. That’s how projects stay useful after launch.

What drives every dashboard

Simple. Honest. Built for the sector in front of us.

We don’t start with flashy visuals. We start with the questions people actually need answered. What’s changing? What’s stuck? What can be improved this week, not this year?

Simplicity first

If something is not instantly clear, we redesign it. That sounds simple, because it is. Why make a dashboard work harder than the person using it?

Transparency built in

No black-box theatre. Clients can see how the predictions work, where the numbers come from, and what should happen next.

Sector expertise

We dig into your world before we write a single line of code. That’s how the dashboard feels specific, not generic.

London-born, community-rooted

We support local business networks across London because useful analytics should help real neighbourhoods, not just boardrooms.

Visit our London workshop

Come in for a cuppa and a chat about your data

Our office on Islip Street is where every dashboard is shaped, tested, and supported. We like being close to the work, and close to the people using it. Wouldn’t you want a partner who knows your area as well as your metrics?

Address

Islip Street, London, NW5 2DL, United Kingdom

Phone

+44 7777 872761

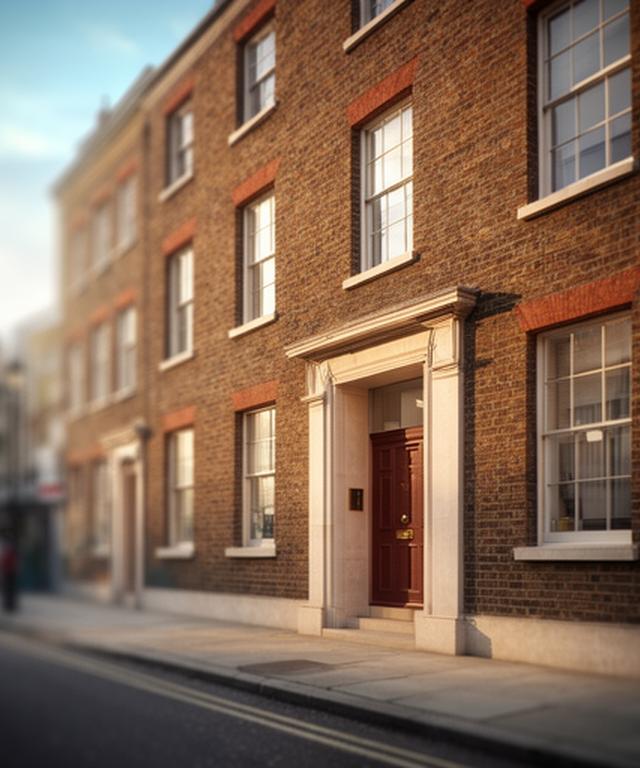
Brick-front London office exterior on Islip Street with a quiet entrance and soft afternoon light

What clients tell us

“We’re always up for a cuppa and a proper chat about your data.”

We keep the atmosphere warm because good decisions rarely come from rushed conversations. Sometimes the best insight starts with a simple question.

Let’s put your data to work

Harris Vision is ready when you are

Need dashboards that feel personal, not punishing? We’d love to hear what you’re trying to solve and show you how a clearer view can change the pace of a week.